Pagers Explained
Some reports work with pagers. Pagers are used to limit the data displayed on screen, shortening the loading time and allowing for easier navigation. If the report has a pager, it will appear at the leftmost part of the filter bar. There, the pager shows up as three light blue arrows («, <, >) and a white box stating 1-x.
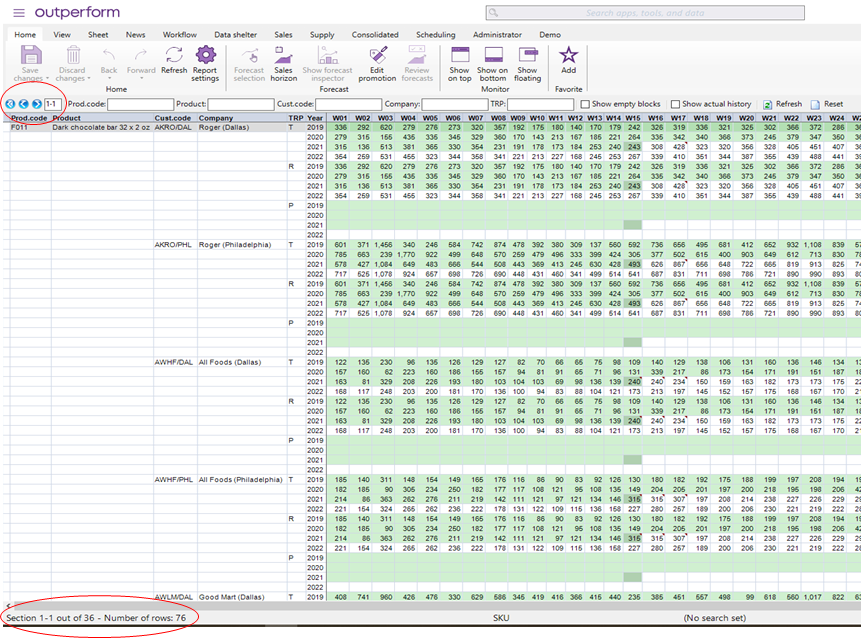
How pagers work: a report collects and displays rows of data from the database. Depending on the content of your database, this can be a lot of data. The more data there is, the longer it will take to render the report. To counter that, the data is portioned into "sections," which are determined by the key value in the first column(s).
Based on the default settings of the pager, the report opens with the information associated with “section(s)” 1-x. The value of x is a default setting for each report. A "section" could be a product, resource, warehouse, etc.; essentially, sections are units divided by the information in the first column of the report.
Say x is set to 10. The content of the screen can be many more than 10 rows because each section can have multiple rows associated with it. So, tuning the default setting of the pager requires some understanding of the underlying data. If the number of rows in the section exceeds the size of the application window, the window will have a scroll bar that allows the user to browse all the rows pertaining to the selected sections.
On the lower left-hand side, the user can see information about how many sections there are in the database and how many rows there are pertaining to the selected sections.
Note that filters and search sets are applied when creating the pages and the page count. So, if a report is structured with the product category as the first column and there are 5 categories A, B, C, D, and E and the pager is set to 1-1, we will see product category A as page 1-1 of 5. If the user switches on a search set containing only products with categories D and E, they will see page 1-1 of 2, which displays only category D.
This example also demonstrates where the performance gain is made. Using search sets and pagers allows the system to first decide that the focus is on D and E, then query one section at a time. Then, the system collects the information for D and displays it for the user. The system can tell the user that there is one more section, but to display the details for section E, it needs to go to the database again. So, if the user wants to see sections D and E as quickly as possible, search sets and pagers combined all the system to quickly fetch and display only the data necessary. Finally, if the user is on page 3-3 before switching on the (D,E) search set, then an empty report will show (displayed as page 3-3 out of 2).
Pagers can be in pager groups. Pager groups are divided via functionality, so all sales reports are in a pager group, all data shelter reports are in a pager group, and so on. When the user adjusts the default pager setting of a report within a pager group, all reports in the group will change as well. For instance, if a user changes the pager settings of a sales report, all sales reports will have the same new pager settings. However, the change is only remembered during that session. The next time the user starts the application, the pager will start from its "factory setting." Note that the sales forecast reports get their settings from the forecast configuration (F6), while pager settings are part of the strategy setting.
Comments
0 comments
Please sign in to leave a comment.